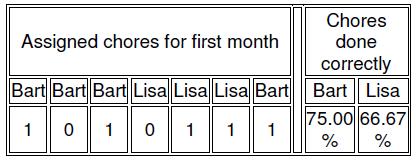
Pro.ID21208 TitleAnd Now For Something Completely Different! Title链接http://10.20.2.8/oj/exercise/problem?problem_id=21208 AC0 Submit0 Ratio- 时间&空间限制描述Bart and Lisa Simpson have many chores, but they don't always do them well. So their father began keeping score, giving them credit only if a chore was done right. After a month, he showed them his record keeping.
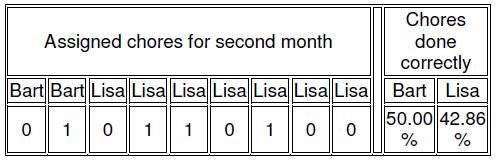
This showed that Bart had done 3 out of 4 chores correctly and Lisa had done 2 out of 3 chores correctly. Then for a second month, Bart and Lisa did chores and the record keeping looked like this:
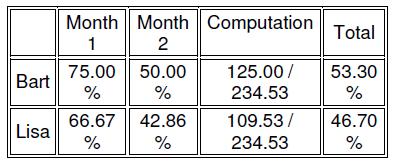
The father made the following chart to support the hypothesis that Bart was doing the most chores:
Lisa looked at the tables then said "No no no, that's not right, I've done more." Bart pointed at the statistics and said, "Numbers don't lie." Lisa said, "But look, I've done 5 chores and you've only done 4. You just look good because you always run away before somebody asks you to do something. The total should give me 55% of the total chores done right." Bart laughed and ran away. Now Lisa needs your help to show the unfairness of these chore evaluations. She wants a program which computes the averages over the entire dataset and displays where the before and after averages support the opposite hypothesis than would be indicated by considering the total dataset. To be fair, she only wants to consider record keeping times when both she and Bart have chores assigned both before and after the record keeping. 输入The first line of each test case contains one integer N (2 <= N <= 50000) the number of chore records. Each of the next N lines in each test case contains either "Bart" or "Lisa" followed by an integer, 0 or 1. The name shows who was assigned a chore, and the integer is a value of 1 if it was done correctly, or a 0 if it was not. Both Bart and Lisa will have chores assigned to them in each dataset. Input ends when N = 0. 输出Description Bart and Lisa Simpson have many chores, but they don't always do them well. So their father began keeping score, giving them credit only if a chore was done right. After a month, he showed them his record keeping.
This showed that Bart had done 3 out of 4 chores correctly and Lisa had done 2 out of 3 chores correctly. Then for a second month, Bart and Lisa did chores and the record keeping looked like this:
The father made the following chart to support the hypothesis that Bart was doing the most chores:
Lisa looked at the tables then said "No no no, that's not right, I've done more." Bart pointed at the statistics and said, "Numbers don't lie." Lisa said, "But look, I've done 5 chores and you've only done 4. You just look good because you always run away before somebody asks you to do something. The total should give me 55% of the total chores done right." Bart laughed and ran away. Now Lisa needs your help to show the unfairness of these chore evaluations. She wants a program which computes the averages over the entire dataset and displays where the before and after averages support the opposite hypothesis than would be indicated by considering the total dataset. To be fair, she only wants to consider record keeping times when both she and Bart have chores assigned both before and after the record keeping. Input The first line of each test case contains one integer N (2 <= N <= 50000) the number of chore records. Each of the next N lines in each test case contains either "Bart" or "Lisa" followed by an integer, 0 or 1. The name shows who was assigned a chore, and the integer is a value of 1 if it was done correctly, or a 0 if it was not. Both Bart and Lisa will have chores assigned to them in each dataset. Input ends when N = 0. Output Write on the first line of the output for each test case, the test case number, and the number of chores correctly performed by Bart (CB) and Lisa (CL) in the following format:
Case <case number>: Bart did <CB> and Lisa did <CL>
If Bart and Lisa do the same number of chores over the entire dataset, there is no trend to oppose. In that case, print "Bart and Lisa accomplished same number of chores".
If Bart and Lisa do a different number of chores over the entire dataset, determine if there are any places in the dataset where taking the averages of all results before and after a record keeping break would produce results which would indicate a trend opposing the trend over the entire dataset. If there are no such cases, print on the next line, "Simpson's paradox not detected". Otherwise, print on the next line "Trend measured in 2 parts is reversed" and on every following line print the following:
After chore <chore number>: <BBefore>% <LBefore>% <BAfter>% <LAfter>%
where BBefore is Bart's correctly performed chore percentage before the record keeping, LBefore is Lisa's correctly performed chore percentage before the recordkeeping, BAfter is Bart's correctly performed chore percentage after the first record keeping until the end of the dataset, and LAfter is Lisa's correctly performed chore percentage after the first record keeping until the end of the dataset. Note that chores are numbered from 1 to N in order of appearance in the dataset. All percentages must be rounded to the nearest .0001. Print a blank line between the outputs for two consecutive test cases. Clarification: Because Lisa wants a program which “displays where the before and after averages support the opposite hypothesis than would be indicated by considering the total dataset”, then any averages which, after rounding, are printed as equal must be disregarded. Sample Input 16
Bart 1
Bart 0
Bart 1
Lisa 0
Lisa 1
Lisa 1
Bart 1
Bart 0
Bart 1
Lisa 0
Lisa 1
Lisa 1
Lisa 0
Lisa 1
Lisa 0
Lisa 0
2
Lisa 1
Bart 1
2
Lisa 0
Bart 1
0 Sample Output Case 1: Bart did 4 and Lisa did 5
Trend measured in 2 parts is reversed
After chore 4: 66.6667% 0.0000% 66.6667% 55.5556%
After chore 5: 66.6667% 50.0000% 66.6667% 50.0000%
After chore 7: 75.0000% 66.6667% 50.0000% 42.8571%
Case 2: Bart did 1 and Lisa did 1
Bart and Lisa accomplished same number of chores
Case 3: Bart did 1 and Lisa did 0
Simpson's paradox not detected Source 样例输入16
Bart 1
Bart 0
Bart 1
Lisa 0
Lisa 1
Lisa 1
Bart 1
Bart 0
Bart 1
Lisa 0
Lisa 1
Lisa 1
Lisa 0
Lisa 1
Lisa 0
Lisa 0
2
Lisa 1
Bart 1
2
Lisa 0
Bart 1
0 样例输出Case 1: Bart did 4 and Lisa did 5
Trend measured in 2 parts is reversed
After chore 4: 66.6667% 0.0000% 66.6667% 55.5556%
After chore 5: 66.6667% 50.0000% 66.6667% 50.0000%
After chore 7: 75.0000% 66.6667% 50.0000% 42.8571%
Case 2: Bart did 1 and Lisa did 1
Bart and Lisa accomplished same number of chores
Case 3: Bart did 1 and Lisa did 0
Simpson's paradox not detected 作者 |
 |Archiver|手机版|小黑屋|同和创作矩阵
( 粤ICP备20019636号-1 )
|Archiver|手机版|小黑屋|同和创作矩阵
( 粤ICP备20019636号-1 )
GMT+8, 2025-2-2 18:06 , Processed in 0.036641 second(s), 14 queries .
Powered by Discuz! X3.4 Licensed
© 2001-2017 Comsenz Inc.