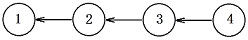
Pro.ID21602 TitleHostipal Title链接http://10.20.2.8/oj/exercise/problem?problem_id=21602 AC0 Submit0 Ratio- 时间&空间限制描述Given a directed graph G = (V, E), each node represents a city. In order to provide medical service in cities, a few hospitals need to be built in some of the cities. For some reasons, one hospital can just be put in one city, and two hospitals can not be put in two adjacent cities. Two cities i and j are considered adjacent if and only if there is an edge from i to j or from j to i. So there might be some cities have no hospitals in them, people of those cities can require the hospital to send doctors to their cities. Of course people will choose the city which is the closest to call. But if the closest city to travel is still far away, people would not satisfy with the quality of the medical service since much time would be taken on the travel. The dissatisfaction of people of the city which has no hospital can be measured as following: S[i] = (number of edges from the closest hospital to city i / 3) * U i is the city without hospital, and U is a constant integer, which will be given as input. And "/" means integer division. Your task is finding a plan of putting hospitals in cities so that the sum of dissatisfaction of the cities without hospitals is minimum. Note that you should make sure the service cover all cities, which means that there should no city can not be serviced. Figure 1 is an example with four nodes. Supposed U is 10. If we put one hospital in node 4, so the node 1 will have a dissatisfaction of 10. A perfect plan is to put a hospital in node 2 and node 4.
Figure 1 Example with four nodes 输入Input may consist of several test data sets. For each data set, it can be formatted as below: First line comes with two integers, N and M, the number of nodes and edges. 1 ≤ N ≤ 100, 0 ≤ M ≤ 10000. Then comes M lines, each line has two integers x and y, 1 ≤ x, y ≤ N, representing an edge from node x to node y, x ≠ y. Finally comes an integer U, the constant number described as above. 1 ≤ U ≤ 500. Input is ended with N = M = 0. 输出Description Given a directed graph G = (V, E), each node represents a city. In order to provide medical service in cities, a few hospitals need to be built in some of the cities. For some reasons, one hospital can just be put in one city, and two hospitals can not be put in two adjacent cities. Two cities i and j are considered adjacent if and only if there is an edge from i to j or from j to i. So there might be some cities have no hospitals in them, people of those cities can require the hospital to send doctors to their cities. Of course people will choose the city which is the closest to call. But if the closest city to travel is still far away, people would not satisfy with the quality of the medical service since much time would be taken on the travel. The dissatisfaction of people of the city which has no hospital can be measured as following: S[i] = (number of edges from the closest hospital to city i / 3) * U i is the city without hospital, and U is a constant integer, which will be given as input. And "/" means integer division. Your task is finding a plan of putting hospitals in cities so that the sum of dissatisfaction of the cities without hospitals is minimum. Note that you should make sure the service cover all cities, which means that there should no city can not be serviced. Figure 1 is an example with four nodes. Supposed U is 10. If we put one hospital in node 4, so the node 1 will have a dissatisfaction of 10. A perfect plan is to put a hospital in node 2 and node 4.
Figure 1 Example with four nodes Input Input may consist of several test data sets. For each data set, it can be formatted as below: First line comes with two integers, N and M, the number of nodes and edges. 1 ≤ N ≤ 100, 0 ≤ M ≤ 10000. Then comes M lines, each line has two integers x and y, 1 ≤ x, y ≤ N, representing an edge from node x to node y, x ≠ y. Finally comes an integer U, the constant number described as above. 1 ≤ U ≤ 500. Input is ended with N = M = 0. Output For each data set, first output one integer in one line, representing the minimum dissatisfaction of the optimal plan. Then output one integer in second line, representing the number of hospitals of your plan. Finally output all city numbers which has hospitals in one line in ascending order, separated with one blank space. Sample Input 4 3 Sample Output 0 Source 样例输入4 3 样例输出0 作者 |
 |Archiver|手机版|小黑屋|同和创作矩阵
( 粤ICP备20019636号-1 )
|Archiver|手机版|小黑屋|同和创作矩阵
( 粤ICP备20019636号-1 )
GMT+8, 2025-2-3 11:59 , Processed in 0.036727 second(s), 14 queries .
Powered by Discuz! X3.4 Licensed
© 2001-2017 Comsenz Inc.